
THOUGHTS ON THE MARKET
Larry Adam, CFA, CIMA®, CFP®, Chief Investment Officer – May 5, 2022
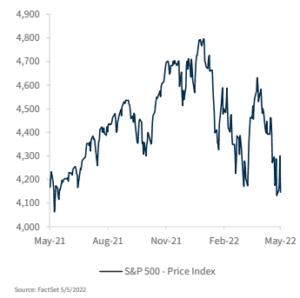
Volatility is never comfortable, and this year is no exception. With today’s drawdown, the S&P 500 is now down 13% year-to-date and is near the lowest level since May of 2021. Interestingly, despite the sharp gyrations throughout the week, the market is now at about the same level as at the beginning of the week. This is why it is important to put the recent volatility into context. Investors are trying to time the change in the inflation trajectory, Federal Reserve policy, China’s zero-COVID policy and the strength of the economy. But these changes tend to be slow developing and are nowhere near as reactive as the markets would have you believe. That is why we encourage investors not to watch and certainly not make investment decisions based on these daily headlines and sharp market moves.
Case in point, the volatility and whipsaw nature of the market has seemed never ending, as the S&P 500 has moved over 1% in either direction in over 50% of the trading days year to-date, including 14 trading days with over 2% moves! This week alone we saw back-to-back 3% moves! In fact, after Fed Chair Powell took a 75 bp rate hike off of the table, the S&P 500 posted its best daily gain (+3.0%) since October 2020 and the 2-year Treasury yield saw its largest daily decline (-12 bps) since March 2022. But today as investors have had time to digest Chair Powell’s commentary, the market completely reversed these moves. The S&P 500 is now lower than at the time of the Fed announcement and Treasury yields are well above the levels of yesterday.
Making matters worse, there are few places for investors to hide (commodities, specifically oil, being one), as the typically less volatile asset such as bonds (Bloomberg US Aggregate Bond Index) is in the midst of its worst drawdown since the 1970s as bond yields continue to surge higher. The 10-year Treasury yield is now up ~160 bps year-to-date to its highest level since November 2018. As a result, a typical 60/40 portfolio has posted the worst start to a year at this juncture since at least 1975. There are a number of risks for the market and the nearterm outlook remains cloudy as we await the resolution of the aforementioned issues. We continue to expect elevated levels of volatility with the equity market spending much of its time range-bound (4,200 – 4,600). However, for longerterm investors, we believe that we may be nearing peak levels of depressed sentiment and that fundamentals continue to suggest that equities should be higher over the next 12 months. In times like this we strip the emotion from investing and turn to fundamentals—because ultimately they determine where asset classes go in the long term. The following factors continue to provide the foundation for our outlook:
• Muted Recession Risk — Assessing the business cycle is critical for equity investors. While areas overseas continue to struggle (e.g., Europe due to its proximity to Russia/Ukraine), domestic demand in the US remains strong. The robust labor market (record job openings—the US has added ~600k jobs on average over the last six months) should continue to drive consumer spending and elevated CAPEX (durable goods orders rose at the fastest pace in six months in March) also remains supportive of growth. In addition, a sustainable reopening and increase in services pending should also drive growth. This is consistent with commentary from Chair Powell at his press conference, as he acknowledge that the US economy is “very strong and well positioned to handle tighter monetary policy”. Our economist, Scott J. Brown PhD, continues to place a low probability on a recession unfolding over the next twelve months or so.
• Peak Fed Hawkishness/Inflation — Evidenced by today’s market action, the trajectory for both Fed policy and inflation remain key drivers for both the equity and bond markets. With inflation rising at the fastest pace in 40 years, the market has priced in almost 275 bps worth of tightening in 2022 alone, which would be the largest amount of tightening over a 12-month period since 994. In addition, another 50 plus basis points of tightening is priced into mid-2023. However, as normalizing supply chains, building inventories and an expected slowdown in goods prices suggest that we are at ‘peak’ inflation, we also believe that we are nearing ‘peak’ hawkishness on Fed policy. As inflation begins to rollover, which we expect to see the beginning signs of in the April
CPI report to be released next week (the pace of core CPI is expected to slow on a year-over-year basis from +6.5% to +5.8%, the first monthly slowdown since August 2021), we believe that the expectations for Fed rate hikes will begin to moderate. This should be supportive of risk assets and allow bond yields to decline moving forward.
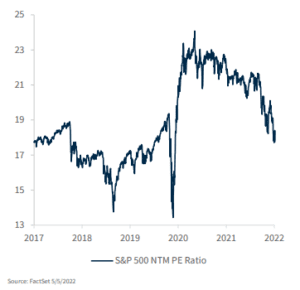
• Supportive Earnings — Evidenced by the 1Q22 earnings season, corporate fundamentals remain solid. While the pace of earnings growth is moderating, our expectation of 9% EPS growth in 2022 remains above the previous 20-year average of 8%. It is also worth noting that although we have seen some giveback this week, forward earnings estimates for both 2022 and 2023 remain over 2% higher relative to the start of the year. This is unusual as earnings are historically revised lower as we progress throughout the year. Positive earnings growth, combined with a 14% decline year-to-date in the equity market, has led to a nearly 20% contraction in the Next Twelve Months S&P 500 PE multiple year-to-date.
• Corporate Activity — With nearly record levels of cash on corporate balance sheets, businesses continue to return cash to shareholders through both dividends and buybacks. S&P 500 dividends are expected to grow 8% and buybacks are on pace to post nearly the strongest year on record in 2022.
• Peak Treasury Yields? — The overshoot in inflation has led to an increasingly hawkish Fed and a substantial ramp up in rate hike expectations over the next 12 months. Expectations of tighter monetary policy have led to sharply higher interest rates. While yields historically peak at the end of a tightening cycle, the front-loading of the rate moves in this cycle is a bit unusual. The velocity of the rate increases over the last few months has been notable and is already starting to have an impact on the real economy. This is evident in the sharp declines we’ve seen in mortgage applications lately. This suggests to us that longer-maturity yields are near their peak and should start to stabilize/decline as inflation pressures ease and tighter policy begins to cool demand.
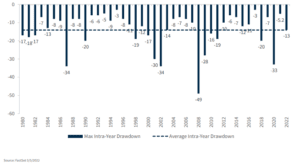
 Bottom Line —The first two years of a bull market tend to lead to investor complacency as returns are robust and broad based. The third year tends to be different and defined by more volatility, muted returns, and the need to be more selective. Thus far, this third year has been no different. In fact, while this downside volatility may seem extreme, it is worth noting that it really is an
‘average’ pullback. The current 13% decline matches the average intra-year pullback that the S&P 500 has typically experienced dating back to 1980. What has made the recent downturn feel even worse is the fact that bonds have not provided the ballast they typically do during market corrections. While the losses on the fixed income portion of a diversified portfolio mix are painful, the silver lining is that the recent sell-off in bond market has put the ‘income’ back in fixed income for investors and there is now value in many sectors of the bond market. Although we expect volatility to remain elevated, we caution investors from panic selling as fundamentals continue to support a move higher from current levels over the next 12 months and the back-up in bond yields has created opportunities for income-oriented investors.